

Power BI vs Excel is not a contest between a better and worse tool. Excel gives you a flexible space for calculations and exploration; Power BI helps you deliver governed, interactive reports when your CRM, marketing and billing data need to work together.
Key takeaways
Power BI and Excel at a glance
Excel is a flexible workbook for calculations, exploration, ad hoc analysis and data entry. Power BI is a reporting platform built around a reusable data model, designed to give people a consistent view of key measures through interactive reports.
The better choice depends on who uses the output, how often it changes and who owns its refresh and maintenance. Choosing by chart features alone misses the work that keeps reporting reliable.
| Decision | Excel | Power BI |
|---|---|---|
| Core use | Flexible workbook for analysis, calculations, data entry and quick exploration. | Governed reports and interactive dashboards built on a reusable data model. |
| Data preparation | Power Query can connect to data and repeat transformation steps; users can also edit cells directly. | Power Query prepares data for a shared reporting model, reducing repeated manual preparation. |
| Modelling and calculations | Worksheet formulas, PivotTables and, in the Data Model, Power Pivot and DAX. | Relationships and DAX measures support reusable calculations across reports. |
| Visualisation | Charts, PivotCharts, PivotTables and slicers suit direct workbook exploration. | Interactive reports support filtering and exploring data through a shared model. |
| Refresh | Refresh depends on workbook setup and how the file is used and maintained. | Published reports can use scheduled refresh, with connectivity and error handling to manage. |
| Collaboration | People can edit a shared workbook, but parallel copies and manual hand-offs can complicate control. | Teams typically publish reports for controlled viewing and interaction, with separate build and administration roles. |
| Security | Workbook and file access controls govern who can access or edit the file. | Permissions can be managed for published content; row-level security can restrict which records viewers see. |
| Learning effort | Familiar spreadsheet skills make simple analysis approachable; robust models still need care. | Report building adds concepts such as relationships, DAX, publishing and access administration. |
| Sharing costs | Depend on how the organisation provides and shares its Microsoft tools. | Depend on licences, capacity, recipient access and workspace administration. |
For a Power BI vs Excel dashboard decision, focus on the job after the chart is built. A Power BI report is not a replacement for an editable operational workbook or CRM form, and a polished workbook is not automatically a governed reporting system.
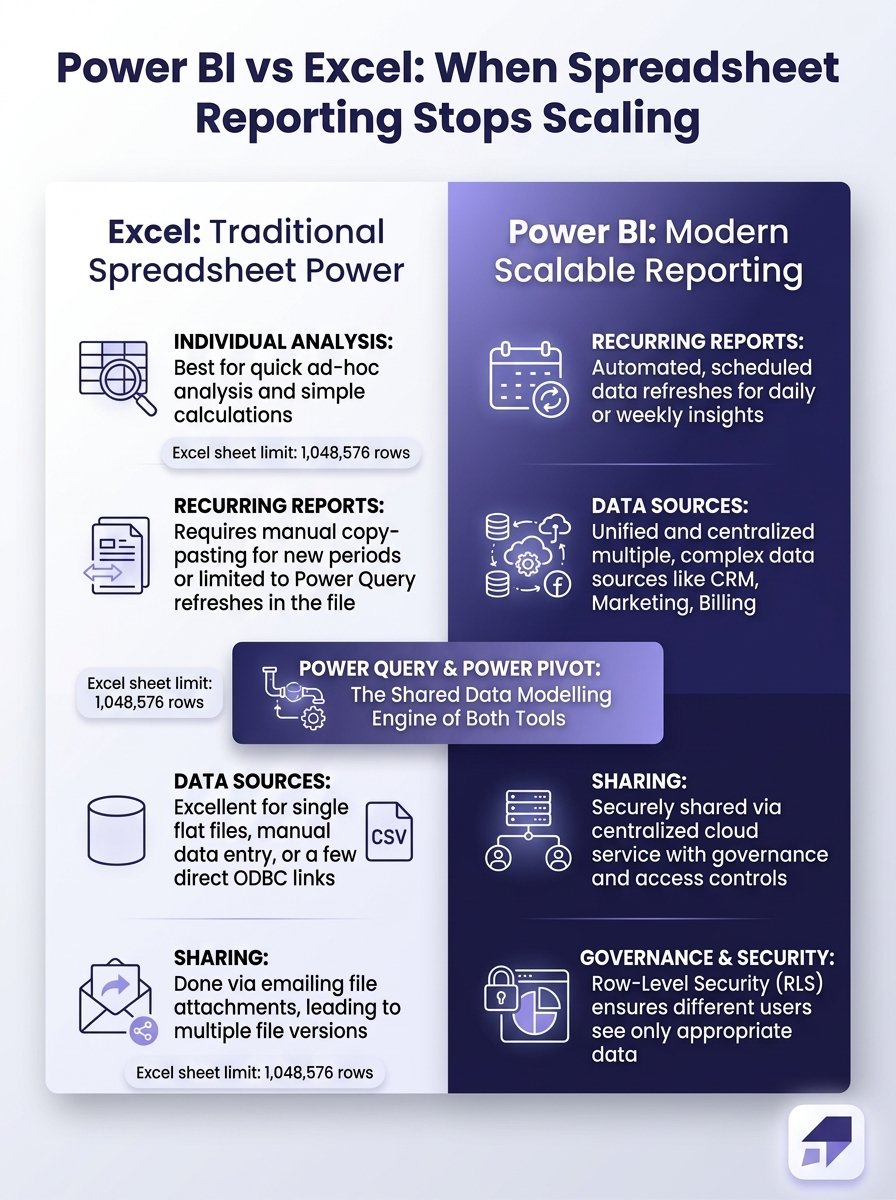
This infographic compares Power BI and Excel as reporting tools, highlighting considerations for choosing the right fit. Use it as a quick guide alongside the article.
When Excel is still the right tool
Excel remains a strong choice when the work is exploratory, editable or short-lived. Keep a workbook for a one-off analysis, a scenario model, a calculation that needs rapid adjustment or small-scale data entry.
For a manageable dataset, a PivotTable and slicers can help an analyst answer questions directly without building a separate reporting experience. That works especially well when the audience is comfortable working in the workbook itself.
An Excel worksheet is limited to 1,048,576 rows. Excel’s Data Model can hold more than a single worksheet, but it does not remove the need to consider available memory, model design and whether the workbook remains usable for its audience.
The tipping point is not simply a large file. A workbook becomes a poor fit when several people edit separate copies, repeat the same manual steps or rely on formulas that no one has documented.

The tipping point: when spreadsheet reporting stops scaling
Move a recurring report towards a shared model when you repeatedly combine CRM, marketing and billing data. Manual exports, copy-and-paste steps and hand-built reconciliations delay the report and make it harder to identify where figures diverged.
Conflicting workbook versions, fragile formulas and unclear metric definitions are practical signs that your team needs a consistent report. One shared definition of revenue or conversion is easier to maintain than several competing calculations scattered across files.
- Refresh depends on memory. Someone has to remember which files to download, which tabs to replace and which formulas to fill.
- People debate the number. Teams use different definitions or cannot trace a reported figure to its source and calculation.
- More people need the same view. Distributing copies makes it harder to keep everyone on the same version.
- Access must vary by user. A shared dashboard may need row-level security so viewers see only the records they are permitted to access.
Refresh is an ownership decision, not just a button. Assign someone to maintain source connections and credentials, configure any required gateway, manage the refresh schedule and respond to failures.
When the business needs a reporting model designed around its decisions, Custom Power BI brings together clean database views and tables with dashboards built for those decisions. That makes it relevant when recurring reporting needs a maintained data foundation, not just another chart.
Power Query, Power Pivot and calculations
Power Query is available in both Excel and Power BI. It connects to data and applies repeatable preparation steps, such as selecting columns, changing data types, filtering rows and combining tables.
Build those steps so another person can understand and maintain them. A refreshable query is more dependable than a process that relies on someone remembering the right order for manual cleanup.
Excel’s Power Pivot works with the Excel Data Model and DAX. Power BI Desktop also builds a tabular data model and uses DAX, so the concepts transfer, but an Excel workbook does not automatically become a well-designed Power BI model when imported.
Worksheet formulas usually calculate from cell references and fill down rows. DAX measures calculate in the context of model relationships and report filters, which makes them useful for reusable metrics such as revenue or conversion rate.
For reporting across business processes, prefer a tidy model with fact tables for events or transactions and descriptive dimension tables for items such as dates, customers, campaigns or products. Clear relationships between those tables are easier to reason about than one flattened table that mixes different levels of detail.

Refresh, sharing and governance are part of the choice
An Excel workbook can be shared for direct editing. Power BI reports are typically published to the Power BI Service for people to view and interact with, while report creators build in Power BI Desktop.
Before publishing, map who can build, administer and view the content. If users must see only permitted records, define and test row-level security as part of that access plan.
Sharing also involves recipient access, licences, workspace administration and data connectivity. The setup and cost depend on the organisation’s chosen licensing and capacity arrangements, so include those needs before committing to a reporting workflow.
Teams using on-premises data may need a gateway to connect published reports to those sources. DirectQuery is another connectivity mode, where Power BI queries the underlying source rather than relying only on an imported copy; its suitability depends on the source, model and report experience required.
If the workflow needs people to enter or write back data, keep that task in an appropriate input system or workbook and define how the resulting data reaches the reporting model. A report is for viewing and analysis, not a general-purpose form for updating CRM or billing records.
Move a workbook to Power BI in stages
Preserve useful logic, and adapt the workbook’s layout and formulas where needed to create a reporting model. A staged migration lets the team compare results and resolve differences before changing its reporting routine.
- Choose one recurring report. Document its source files, transformation steps, formulas, metric definitions, refresh owner and intended audience.
- Rebuild the preparation and model deliberately. Reuse suitable Power Query steps, then redesign relationships and calculations where the workbook’s layout does not translate well.
- Validate the data. Compare row counts, totals, date ranges and key segments, then reconcile Power BI results against the existing workbook.
- Run both reports in parallel. Agree a validation period, investigate discrepancies and assign ownership for refresh failures and permissions before retiring the original report.
This approach also makes it easier to keep Excel where it helps. Analysts can continue using workbooks for investigation or input while the wider team moves to one consistent Power BI report.
A short decision checklist
- Choose Excel when the work is exploratory, editable or short-lived, and a small group benefits from spreadsheet flexibility.
- Choose Power BI when a recurring report combines sources, needs shared metric definitions, serves multiple viewers or requires centrally managed refresh and access.
- Use both when analysts need Excel for investigation or input and the wider team needs a consistent Power BI report. Define which system owns each dataset and calculation.
- Name the owners for the data, report maintenance, refresh and error handling, permissions and report audience before you commit.
That is the practical answer to when to use Power BI vs Excel: choose for the workflow and the people who will maintain it, not just the tool that can produce the first chart.

Frequently asked questions
Can I learn Power BI in one day?
You can learn the basics of importing a file, creating a simple visual and applying a filter in a day. Building a dependable model and publishing it with the right refresh and access settings takes more practice.
Is Power BI difficult to learn if I already know Excel?
Excel experience helps with tables, charts and analytical thinking, but Power BI introduces model relationships and filter context. Start with a small dataset and learn how a measure changes as report filters change.
Is Power BI outdated?
No. Power BI remains Microsoft’s business intelligence platform for building and sharing data reports, and its desktop and cloud components support different parts of that workflow. The practical question is whether its modelling and administration fit your team’s needs.
Can Power BI write changes back to a CRM or billing system?
A standard Power BI report is designed for analysis, not as a general write-back interface. If users need to update records, use an appropriate application or controlled input workflow and define how those updates are validated and reflected in reports.
Can Power BI use an Excel workbook as a data source?
Yes, an Excel file can provide data to a Power BI model. For a dependable recurring report, keep its structure consistent and treat changes to sheet names, column names or data types as changes that may affect the connection.
Do I need both Power BI Desktop and Power BI Service?
Power BI Desktop is used to build models and reports, while the Power BI Service is used to publish and share them online. A person who only views a published report may not need to build it in Desktop.
What is one big drawback of Power BI?
Power BI is designed for reporting and analysis, not for editing data or entering records like you can in a spreadsheet or CRM form. Teams that need users to update records must use a separate input workflow.
Conclusion
Power BI vs Excel comes down to flexibility, repeatability and ownership. Excel is still the right tool for hands-on analysis and editable work; Power BI is the stronger fit when multiple sources, shared definitions, controlled access and recurring refresh need to work together.
Start with one report, make its data and calculations clear, and decide who will maintain it. Keep Excel where it adds value, and use Power BI when your team needs one trusted view to share.

Founder of MarTech Stack. SEO, analytics and marketing automation.
LinkedIn