

Regression analysis helps business teams estimate how an outcome varies with one or more factors, such as advertising spend, price or customer behaviour. It can support explanation, prediction and forecasting, but a model’s results need to be read in context before they guide a decision.
Key Takeaways
What regression measures, and what it does not
Regression analysis estimates how an outcome changes in relation to one or more inputs. The outcome is the dependent variable, also called the response variable; the inputs are the independent variables or predictors. For example, a marketing team might use leads as the outcome and advertising spend as a predictor.
Teams use regression to explain relationships, predict outcomes or forecast future values. These are different goals: a model that describes patterns in past data may not predict new cases accurately, and a predictive model does not automatically explain why an outcome occurred.
In linear regression, ordinary least squares chooses the line or plane that minimises the sum of squared residuals. A residual is the observed outcome minus the model’s fitted value for that observation; a positive residual means the actual value was above the fitted value.
For a simple linear model, write the fitted equation as fitted outcome = intercept + (slope × predictor). In multiple regression, add a coefficient-times-predictor term for each predictor; the coefficients are estimated jointly, so each value depends on the other included predictors. Least squares chooses coefficient values that minimise the sum of squared residuals. Squaring stops positive and negative errors from cancelling and gives larger misses more influence.
Residuals should not show a clear pattern if the model has captured the main relationship. A curve, widening spread or sequence in the residuals can point to a poor model fit, a missing relationship or a structure in the data that the model has not accounted for.
Correlation describes how variables vary together, while regression estimates a relationship between a specified outcome and predictors. Neither one, on its own, establishes causation.
Choose a model that matches the outcome and question
Simple linear regression uses one predictor to estimate a continuous outcome, such as the relationship between advertising spend and leads. Multiple linear regression includes several predictors; each coefficient then describes the predictor’s estimated relationship with the outcome while the other included predictors are held constant.
Linear regression suits a continuous outcome when a roughly straight-line relationship is reasonable. For a binary outcome, such as whether a customer churns, logistic regression estimates the probability of the event rather than a continuous value.
If a straight line misses a systematic pattern, consider transformations, polynomial terms or splines to represent a curved relationship. Use an interaction term when the relationship between one predictor and the outcome may change depending on another variable, such as whether a channel’s association with leads differs by region.
Represent categories such as acquisition channel with indicator variables and state the reference category clearly. A coefficient for another channel then describes its estimated difference from that reference, rather than a change per unit of a continuous measure.
ANOVA tests whether a continuous outcome differs across categorical groups. Regression can include those categories alongside continuous predictors, so ANOVA is closely related to linear regression rather than a wholly separate family of methods. Use ANOVA for a focused group comparison; use a regression model when the question also calls for adjustment for other predictors.

Read coefficients, R-squared and p-values in context
A linear regression coefficient is the estimated change in the outcome for a one-unit increase in a predictor, in the units used. In multiple regression, that estimate is conditional on the other included predictors being held constant.
For example, if advertising spend is measured in thousands of euros, its coefficient describes the estimated change in leads for each additional thousand euros of spend, with the other modelled predictors held constant. The intercept is the fitted outcome when all predictors are zero; it may have little practical meaning if zero is outside the range or context of the data.
R-squared describes the share of variation in the outcome accounted for by the fitted model in the data used to build it. A higher value does not establish that a predictor caused the outcome or guarantee accurate predictions on new data.
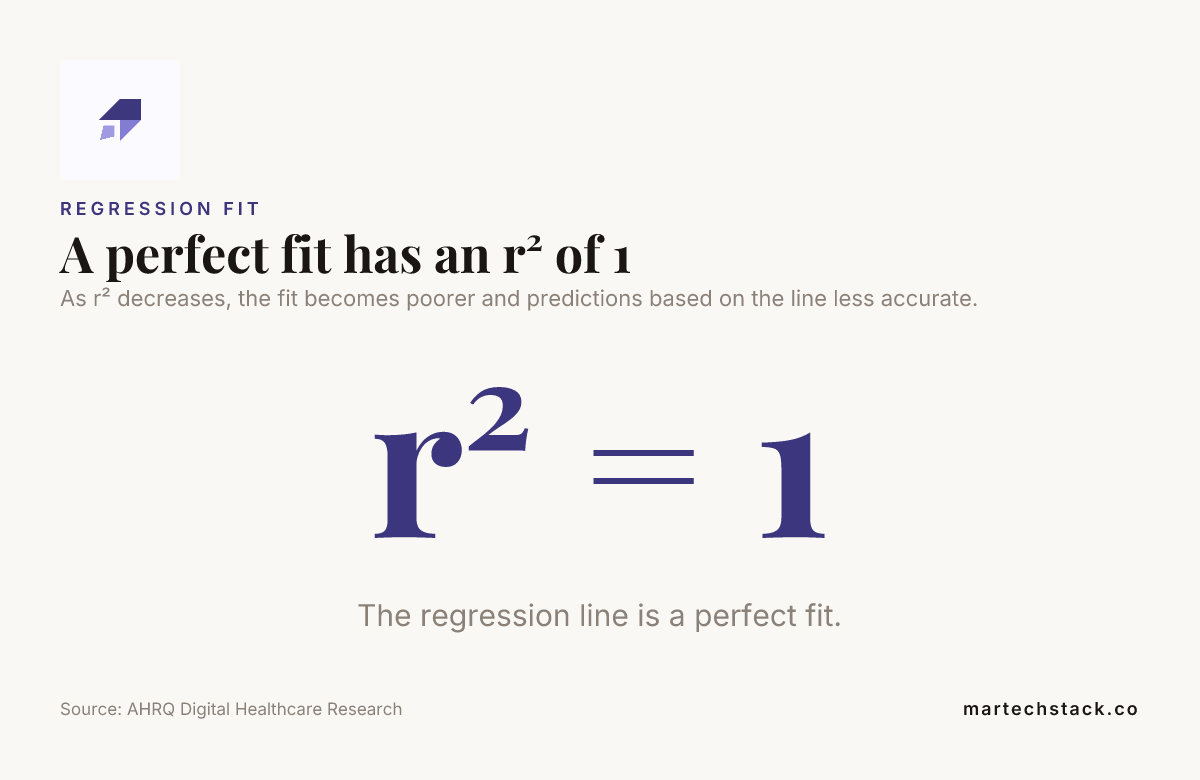
As r² decreases, the fit becomes poorer and predictions based on the line less accurate.
Source: AHRQ Digital Healthcare Research
A p-value measures evidence against a specified null hypothesis, such as a coefficient being zero. It is not the probability that a result is true, and it does not tell you whether the estimated effect is large enough to matter commercially.
Use confidence intervals to communicate uncertainty around an estimate. AHRQ Digital Healthcare Research states that a confidence interval is often 95 percent; statistical evidence and practical importance remain separate questions.
Check assumptions, residuals and data problems
For ordinary least squares, check whether the relationship is reasonably linear, whether residuals have a reasonably consistent spread, and whether observations are independent. A visible residual pattern can mean the model form needs attention; repeated measurements or time-ordered data may also require a model that accounts for that structure.
Multicollinearity occurs when predictors overlap strongly. It can make individual coefficients unstable and difficult to interpret, even when the model’s overall predictions appear useful; examine predictor relationships and diagnostics such as variance inflation factors.
Investigate outliers and influential observations by checking their source and how much they change the estimates. Do not remove a valid observation just because it affects the result; correct data errors, and document any justified exclusions.
Check why values are missing before choosing how to handle them. Dropping incomplete rows can bias results when missingness is systematic, so document exclusions or imputation and test whether the main conclusions change.
Choose predictors from the business question and plausible confounders, not by mechanically adding variables until the fit improves. Small samples can produce unstable estimates and wide uncertainty intervals, while models with too many predictors for the available data can overfit.

Apply regression to marketing and commercial questions
Advertising spend versus leads: define the reporting period and lead measure consistently, then consider channel, seasonality and other relevant factors. A spend coefficient is an adjusted association, not automatically the incremental effect of advertising; consistent event definitions and campaign tracking support a more dependable analysis. Teams reviewing their measurement setup can explore analytics tracking.
Price versus demand: define demand in a consistent unit, such as units sold per period, and consider promotions, product availability and seasonality. Interpret the estimated price relationship within the price range and business context represented by the data.
Drivers of churn: logistic regression can estimate how customer characteristics or behaviours relate to the probability of churn. An adjusted association with churn identifies a pattern for further investigation, not a proven lever.
Include predictors because they help answer the question or address a plausible confounder, not simply because they make the model fit better. Reliable tracking and consistent definitions matter across all three examples, because changes in measurement can look like changes in customer or market behaviour.
Regression analysis in HR
HR teams can use regression to examine associations with outcomes such as employee turnover, absence or compensation while accounting for relevant differences in role, location or tenure. Linear regression may suit a continuous outcome such as compensation; logistic regression can estimate the probability of a binary outcome, such as whether an employee leaves.
Define the outcome clearly, check that measures are consistent across employee groups, and include relevant differences in job mix or location where appropriate. A coefficient is still an adjusted association, not proof that a characteristic causes an outcome. Review data access, possible proxy variables and model performance across groups, and treat results as evidence for further review rather than as a complete employment decision.
Separate association from causal evidence
A regression coefficient describes an association conditional on the predictors included in the model. Unmeasured confounding, reverse causation or selection effects can still explain the relationship, so adjustment does not by itself turn an observed pattern into a causal effect.
Adding a control variable is not always helpful. Controlling for a mediator can remove part of the effect you want to estimate, while conditioning on a shared consequence of two variables can introduce bias.
For a causal claim, use a study design that supports one, such as a well-run randomised experiment where feasible. For observational analysis, state the assumptions behind the comparison and avoid causal wording when those assumptions cannot be defended.
In attribution, distinguish observed channel associations from incremental contribution. The right measurement approach depends on the attribution question; teams can explore data attribution when deciding how to assess channel impact.
Validate predictions before acting on them
Set aside data that the model has not used for fitting, then evaluate its predictions on that data. For time-ordered business information, use a later period as the test set rather than mixing future observations into the training data.
Prevent data leakage by checking that every predictor contains only information that would genuinely have been available at the point a prediction is made. Leakage can make a model appear much more effective in testing than it will be in actual use.
Compare prediction errors with a simple baseline and assess calibration, which checks whether predicted probabilities match observed event rates. Inspect performance across relevant customer groups and time periods, since a strong overall result can hide weaker performance in a group that matters to the decision.
Avoid predictions beyond the observed range or in a different business context without further validation. Before acting, weigh uncertainty against the cost of a wrong prediction and consider whether the decision still makes sense under plausible alternative estimates.
Results are safer to use when data definitions are sound, assumptions and diagnostics have been examined, validation reflects the intended use, and the decision remains reasonable under uncertainty.
Teams that need support cleaning and interpreting data can learn about Data Analysis Services from MarTech Stack, which use Python, R and SQL to analyse data and explain findings in plain language.

Frequently Asked Questions
Is regression analysis hard to learn?
The core ideas are accessible if you begin with the outcome, predictor and fitted relationship before moving to model details. Learning to judge whether the data and model answer the business question takes more practice than learning the terminology.
Can I run regression analysis in Excel?
A spreadsheet can be useful for a small, transparent analysis or a first model, but it cannot decide whether your variables are appropriate or whether the findings support a business decision.
Can regression analysis account for seasonality in monthly or weekly data?
Yes. A model can represent recurring calendar patterns with month or day-of-week indicators, or use other seasonal terms suited to the data. For forecasting, evaluate it on a later period that includes the seasonal pattern you expect it to handle.
How should I explain a regression result to non-technical stakeholders?
Lead with the business outcome, the comparison being made and the units of the estimate, then describe the uncertainty and what the model cannot establish. A simple chart of observed values against fitted values can make the result easier to discuss without relying on statistical shorthand.
What is adjusted R-squared, and when should I use it?
Adjusted R-squared modifies R-squared to account for the number of predictors in a linear model, so it can help compare models with different numbers of predictors on the same data. It is still an in-sample fit measure, not a substitute for checking performance on held-out data.
Should I standardise predictors before fitting regression?
Standardising can help compare coefficient magnitudes when predictors use very different units, because it expresses them on a common scale. Keep the original units in mind when communicating business impact, since standardised coefficients do not directly describe a change in euros, leads or customers.
Can regression analysis combine data from several European countries?
It can, if the outcome and predictors are defined consistently across countries and the analysis accounts for meaningful country-level differences. A country indicator can represent average differences, but it cannot repair inconsistent measurement or make a result automatically transferable between markets.
Conclusion
Regression analysis can help business teams describe relationships, estimate outcomes and build forecasts when the model matches the question and the data. Its coefficients, R-squared and p-values each answer a limited question; none alone proves causation or makes a model ready for use.
Check definitions, assumptions, uncertainty and out-of-sample performance before acting. When those checks support the intended decision, regression analysis can provide useful evidence without claiming more than the data shows.

Founder of MarTech Stack. SEO, analytics and marketing automation.
LinkedIn