
AI Overviews Tracker: How to Measure Your Brand’s Visibility in AI Search
In 2026, you can have “great visibility” in classic reporting and still be invisible in Google AI Overviews, because only 37.9% of the URLs cited in AI Overviews also land in the top 10. That’s exactly why an AI Overviews tracker is no longer a nice-to-have, it’s how you get real answers about Google AI Overviews visibility and brand visibility in AI search.

Key Takeaways
| What you measure | Presence, citation share, where you appear in the overview, cited URL, and whether your brand is mentioned (with sentiment/intent cues). |
| Why GA4 and rank tools miss it | Zero-click behaviour and summarised outputs mean traffic and “top 10” metrics can decouple from being cited. |
| Baseline you can build | Use Search Console query filters, then manually run a query panel to capture citations, positions, and referenced pages. |
| How to evaluate commercial tools | Check whether they capture cited URLs and citation share, not just “it appeared” screenshots. |
| Reporting to stakeholders | Track trends, not guesses, and report side-by-side with classic visibility. Keep it consistent every week or month. |
| Where to start | Start with money pages and homepage, then expand using high-impression queries you already see in GSC. |
- First, confirm the scope: are you tracking AI Overviews for your brand, your products, or both?
- Then, pick your page universe: link your cited URL back to the exact service page(s) you want to be known for.
- Finally, standardise capture: the same query set, the same cadence, the same fields.
If you want a practical measurement setup, we typically tie it back to how we implement digital web analytics and how we turn raw data into reporting you can defend. That same discipline applies here.
Why an AI Overviews tracker is different from rank tracking and GA4
Standard rank trackers exist to tell you where a page sits in a list of results. Google AI Overviews are not a list, they are a summarised answer that may cite multiple sources and then handle the job without sending users to any of them.
That creates three measurement gaps you feel immediately:
- Visibility can rise while clicks fall. In 2026, zero-click behaviour and summarised answers mean GA4 may show less referral traffic even when you are being actively referenced.
- “Top 10” can be decoupled from citations. As noted, only 37.9% of URLs cited in AI Overviews also appear in the top 10.
- Traffic doesn’t tell you about the mention itself. If the overview cites your brand but users don’t click the cited link, you still want to know you were used.
Quick reality check: if your reporting only answers “are we ranking?”, you will miss “were we cited, and how often?” That’s the heart of AI overview monitoring.
So when you build an AI Overviews tracker, you are measuring something fundamentally different: presence inside the overview and the details of how your brand was used.
What an AI Overviews tracker actually measures (fields that matter)
You will get inconsistent results if your tracker only records “appeared or not”. A real AI Overviews tracker captures the mechanics of the citation.
Here are the core fields we recommend for AI Overviews tracking and monitoring:
- Presence: does your brand (or a domain you care about) appear in the overview at all?
- Citation share: across the set of runs for a query, what portion of overviews cite your brand’s URL(s)?
- Position within the overview: where your citation appears relative to other sources (for example, early vs late). This helps you explain visibility changes to stakeholders.
- Cited URL: capture the exact URL that was cited, not just the domain.
- Brand mention: sometimes the brand is mentioned without a direct cited link. Track mentions separately from citations.
- Intent and sentiment cues (lightweight): record whether the reference sounds aligned with your offering and value (for example, “recommended”, “used for X”, vs “not suitable”). Keep this consistent and simple.
- Source count context: AI Overviews often include multiple sources. Track how crowded the overview is, so you can interpret citation share changes.
Why this matters: generative engine optimisation measurement is not just about output frequency. It’s about how your brand is represented in the answer.
Our rule: if you cannot explain it using “cited URL” and “citation share”, you do not yet have an AI Overviews tracker, you have a screenshot collection.
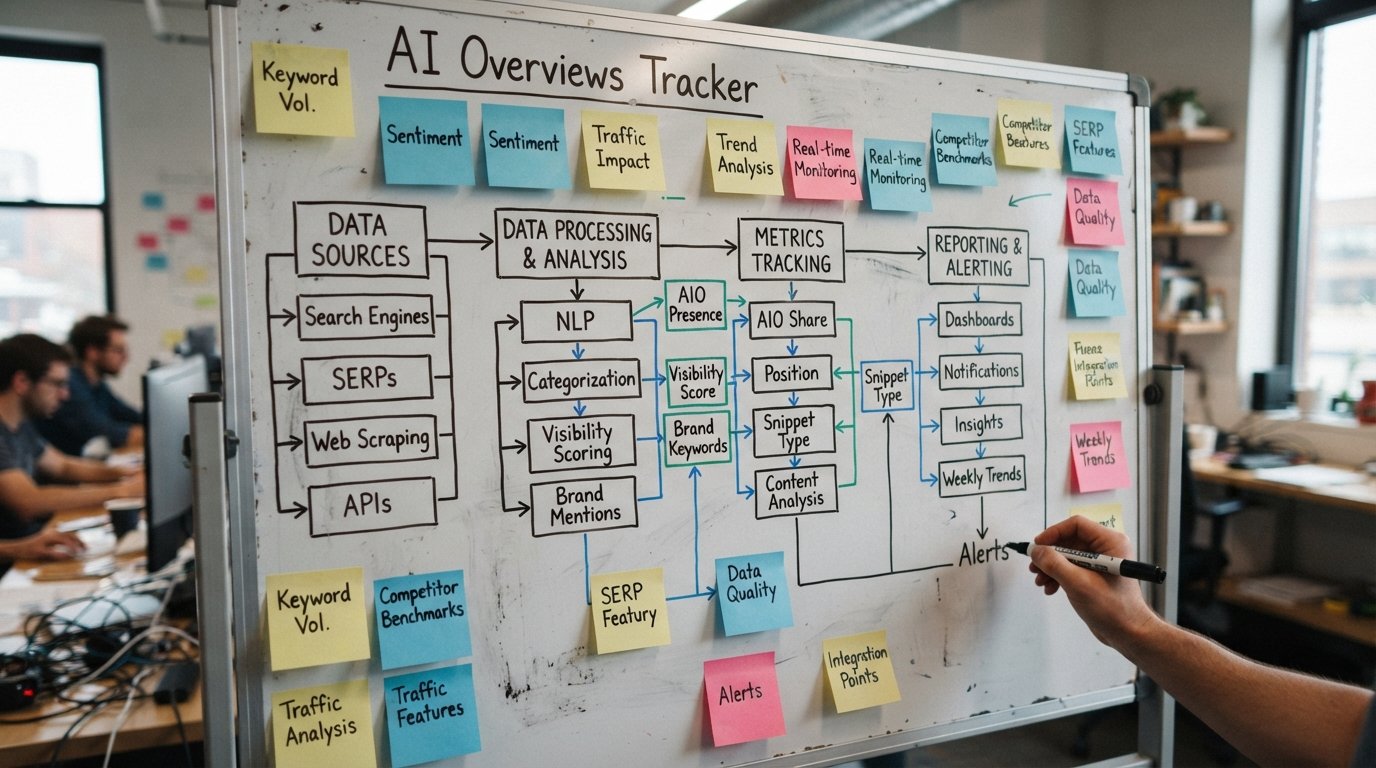
Build a lightweight baseline in 2026 using Search Console, manual query capture, and referral patterns
If you want something you can trust quickly, start with a baseline you build yourself. This is how we do AI search visibility tracking when clients need answers fast, without waiting for a commercial platform.
Below is a straightforward method for measuring brand visibility in AI search that still respects measurement discipline.
Step 1, pick your money pages universe
Begin narrow. Focus on pages that you want cited because they represent your offers.
For example, if you run B2B services, your baseline often starts with:
- Home page
- Core service pages, such as SEO consulting services and data analysis services
- Supporting analytics and measurement pages, such as digital web analytics
Step 2, create a query set from Search Console
Go to Search Console and filter for:
- Queries with meaningful impressions
- Queries that contain longer, conversational wording (they are more likely to trigger AI Overviews in 2026)
- Queries that relate to your services (not just generic category terms)
In 2026, you’ll often get better coverage by prioritising query types that are more likely to generate an overview. For instance, comparison-style queries tend to trigger AI Overviews far more reliably than transactional wording.
Step 3, set up a manual query panel and capture the overview details
Create a simple runbook:
- Choose your top 30 to 60 queries for the first month.
- Run them in a dedicated browser profile.
- For each query, record:
- Whether your brand appears
- Your citation share proxy (does it cite you, and how many times)
- The cited URL(s)
- Where your citation appears (early, middle, late)
- One-line sentiment/intent note (positive, neutral, negative, unclear)
- Repeat on a consistent cadence (weekly is usually enough for baselines).
At this stage, you are not trying to predict outcomes. You are building a baseline so you can detect change.
Step 4, triangulate with referral traffic patterns (so stakeholders believe the story)
Use GA4 to look for patterns, not single data points.
- Compare sessions landing on your money pages vs periods where you see higher citation share
- Track whether the referral path changes when your brand is being cited
- Expect lag, and expect less traffic than classic visibility would generate
Then report it as a narrative: “We are being used in the overview more often, but clicks are limited, so traffic is not the sole proof.”
How to evaluate commercial AI Overviews tracker tools (what to test before you buy)
You will find tools that claim to “track AI Overviews”. Not all of them track what you actually need.
When we evaluate an AI Overviews tracker platform, we run a short test plan:
- Does it capture cited URLs? If it only says “brand present”, you cannot map citations back to your service pages.
- Does it measure citation share over time? You want trends, not one-off screenshots.
- Does it track position within the overview? This helps you explain changes and compare runs.
- Does it record brand mentions separately from citations? Some overviews mention a brand without citing a page you control.
- Can you export your data? You need it to join with your own baselines and reporting cadence.
- How does it handle query intent? Tools that treat all queries equally often underperform on the query sets that matter.
- How stable are results in 2026? Check if the tool gives consistent capture across repeated runs (within reasonable variation).
Then, decide what “good” means for your business in plain terms. For example:
- “We expect citation share to move within 4 to 8 weeks on our core query set.”
- “We want to see which of our service pages are cited more often.”
- “We want our stakeholders to understand why traffic does not equal AI visibility.”
If you want a service-led approach, we also build measurement foundations across analytics. It connects to our wider work around data analysis and reporting you can track over time.

Sampling cadence and query set design for statistically useful AI Overviews tracking
Random sampling gives you noise. A good AI Overviews tracker uses a query set and cadence designed to show change without drowning your team.
Cadence: pick a rhythm you can repeat
For most B2B teams in 2026, we recommend:
- Weekly runs for the first baseline (fast feedback)
- Bi-weekly or monthly once trends stabilise (lower effort)
- Extra runs after major content updates, product launches, or campaign changes
Query set: balance breadth and depth
Your query set should cover:
- Service-intent queries (people describing what they need)
- Comparison-style queries (often trigger overviews more consistently)
- Branded and near-branded queries (to measure recognition)
- Longer conversational queries that reflect how buyers ask questions in real life
In 2026, AI Overviews are far more likely to trigger on searches that contain more words, so your query set design should lean into that reality.
Statistical usefulness: how to keep it honest
Use consistent rules so you can compare results:
- Same location and device profile for each run
- Same query set order (helps you spot capture issues)
- Minimum repeat count: run each query enough times per month to detect directional movement
If you are doing manual capture, you will likely use a smaller set, like 30 to 60 queries. If you use a commercial tool, you can expand, but you still need consistent definitions of presence, citations, and cited URLs.
Common mistake: switching query sets every week. If your query set changes, your numbers stop meaning anything.
Reporting AI Overviews tracking results alongside classic visibility
Your stakeholders will compare everything to classic visibility, because that’s what they understand. Your job is to show them how the measurement fits together.
Here’s a reporting approach that works in 2026 for B2B marketing and SEO leads.
Report in three layers
- Layer 1, AI Overview visibility: presence rate, citation share, cited URLs distribution, position buckets.
- Layer 2, brand representation: brand mentions vs citations, sentiment/intent cues, and source count context.
- Layer 3, traffic and page performance: referral patterns to the cited URLs (and how clicks can understate reach).
Show decoupling clearly, without drama
When users do not click cited links, traffic becomes a weak proxy. So your reporting should explicitly say:
- “We measure citations because clicks are rare.”
- “We compare citation share trends to referral trends, but we expect weaker traffic movement.”
- “We explain page-level results using the cited URL list.”
Use your own story and services pages as anchors
When you present results, tie citations back to the pages your team can influence. For example, if you see more citations to your overview content, that’s direct feedback on which pages are being used in answers. If you see fewer citations to core service pages, you have a measurable gap to address.
And if you need a clear, services-focused measurement narrative, we often structure it around the same categories we ship work in, from our services to supporting capability pages and analytics delivery.
A practical step-by-step playbook you can run this month
Let’s make this real. If you start this week, this is a practical plan for getting an initial AI Overviews tracker baseline in 2026.
-
Define scope (Day 1):
- Brand vs products, which domain(s) count, and what counts as “your citation”.
- Decide the fields you will capture every time (presence, cited URL, position, mention, sentiment cue).
-
Select pages (Day 2):
- Home page and 3 to 6 money service pages.
- Map each page to a simple label you can show stakeholders later.
-
Build query set (Day 3 to 4):
- Pull top queries from Search Console by impressions and relevance.
- Add long conversational phrases and comparison-style queries.
- Keep 30 to 60 queries for the first baseline.
-
Set cadence (Day 4):
- Run weekly for 4 weeks, then decide if bi-weekly works.
-
Create your capture sheet (Day 5):
- One row per query per run.
- Columns for presence, citation share proxy, cited URL list, position bucket, mention flag, and a short sentiment cue.
-
Run and validate (Week 2):
- Spot-check 5 queries manually to confirm your capture is consistent.
- If results vary wildly, tighten your environment settings.
-
Report to stakeholders (End of Week 4):
- Show trends in presence and citation share.
- Show which cited URLs are driving citations.
- Add a short section comparing to referral trends, explaining why clicks are not the main measurement here.
That’s your minimum viable AI overview monitoring system. From there, you can expand your query set, automate capture, or adopt a commercial tracker if the effort becomes too high.
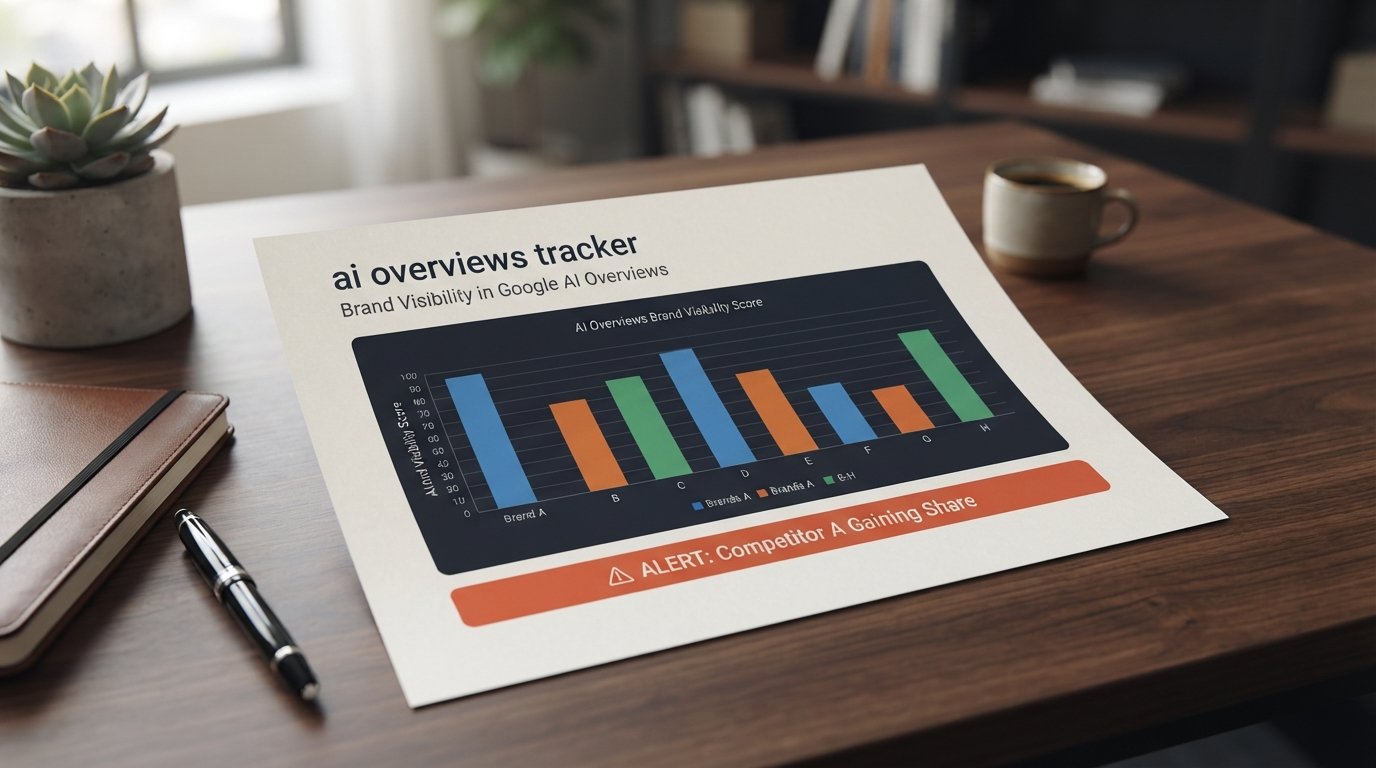
Frequently asked questions about an AI Overviews tracker
What does an AI Overviews tracker measure if clicks are so low?
An AI Overviews tracker measures presence, citation share, cited URLs, and where your brand appears in the overview. Because clicks are rare, the focus is on being used in the answer, not on traffic as the only proof.
How do I track Google AI Overviews visibility using GA4 and Search Console together in 2026?
You use Search Console to build the query set for AI search visibility tracking, then you capture AI Overviews results manually or with a tool. GA4 becomes the supporting layer to interpret referral patterns, not the primary measurement for brand visibility in AI search.
Is an AI Overviews rank tracker enough, or do I need something else?
A rank-tracker-style approach is rarely enough on its own, because AI Overviews are not comparable to a top 10 list. You need a tracker that records citations and cited URLs, so you can measure generative engine optimisation in terms that actually reflect usage.
What query set should I start with to track AI Overviews in B2B?
Start with money pages and a query set built from Search Console impressions, then add longer conversational and comparison-style phrases. AI Overviews are more likely to appear on those query types in 2026.
How often should we run AI Overviews tracking to see meaningful change?
For most teams, weekly runs for the first month give you enough signal to build confidence. After that, switch to bi-weekly or monthly runs, and do extra checks after major changes to your service pages.
How do I explain results to stakeholders when visibility rises but referral traffic doesn’t?
Tell them that AI Overviews can deliver the value without sending users to cited links. Your reporting should highlight citation share and cited URLs, then use referral traffic as a secondary signal rather than the main metric.
Conclusion
An AI Overviews tracker gives you the missing measurement for Google AI Overviews visibility in 2026. Instead of trying to force AI citations into classic “top 10” thinking or trusting referral traffic alone, you capture what matters, presence and citation detail, so your team gets answers you can defend.
With a lightweight baseline from Search Console, a consistent manual query panel, and clear reporting alongside classic visibility, you can start tracking now. And if you later move to a commercial platform, you will know exactly what to verify, citation share, cited URLs, and position within the overview.
