
Time series analysis helps you understand what is changing in your marketing and sales data, and what is simply part of a recurring pattern. We’ll show you how to read trends, seasonality and noise, then turn those insights into more dependable forecasts.
Key Takeaways
What the data can tell you
A time series is a set of observations recorded in time order. Website visits by day, monthly leads, weekly sales and quarterly revenue all count. The order matters: unlike cross-sectional data, which compares different people, products or regions at one point in time, a time series also carries information about what came before.
That creates an important difference. A rise in leads this month may reflect genuine growth, a predictable seasonal peak, a short promotion or a tracking change. Time series analysis helps you distinguish these explanations before you make a budget or staffing decision.
You can use it to describe past performance, find unusual changes, compare channels and forecast future results. It does not have to begin with advanced software. A clear chart and a well-chosen comparison can reveal a great deal.
Trend, seasonality, cycles and residual noise
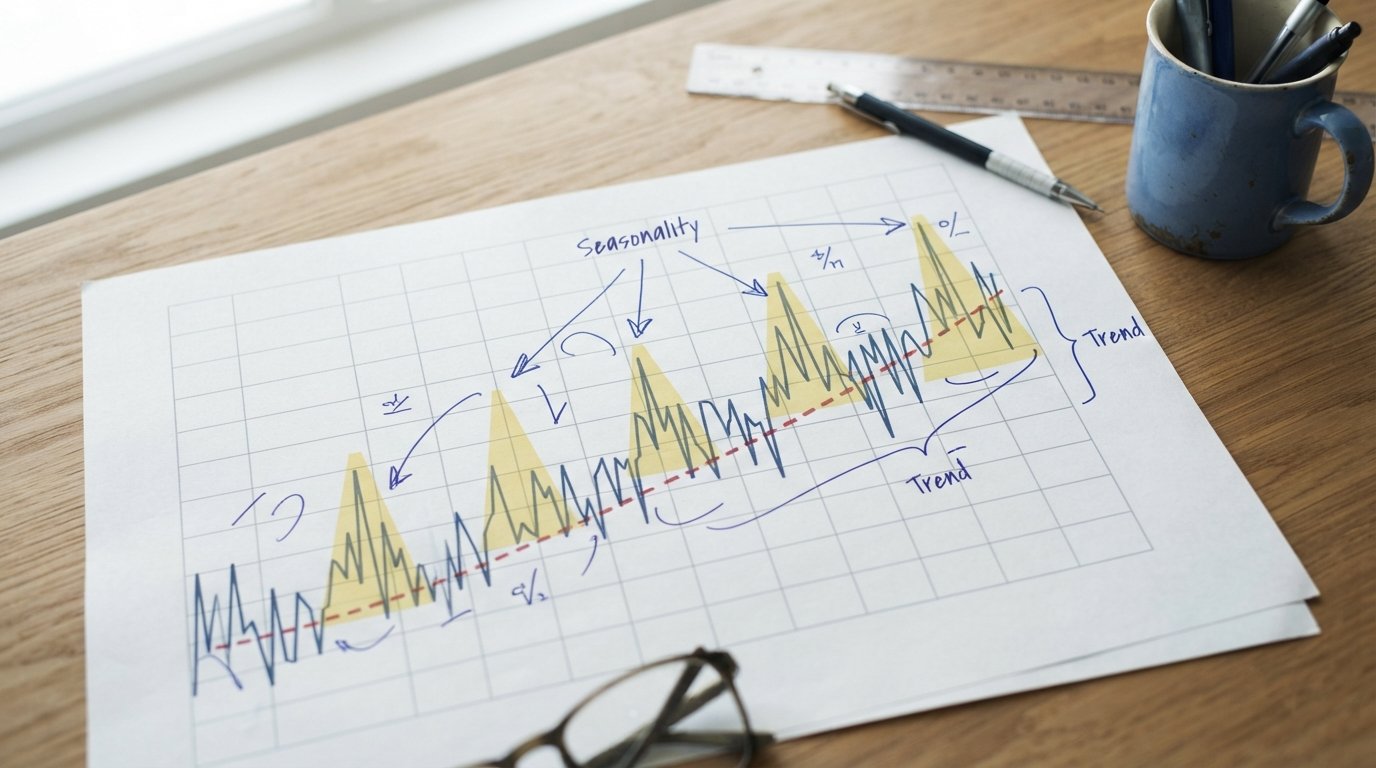
A useful starting point is to think of observed data as a combination of components. Decomposition separates a series into trend, seasonal variation and residuals, also called noise. It gives you a more structured view of what the numbers are doing.
- Trend: The long-term direction of a metric. Web traffic may climb as brand awareness grows, or revenue may fall as a product line matures.
- Seasonality: A pattern that repeats at a known interval, such as higher e-commerce sales in December or predictable differences between weekdays and weekends.
- Cyclical variation: Broader rises and falls that do not follow a fixed calendar schedule. Market conditions can influence business demand over longer periods.
- Residuals: The variation left after the model accounts for trend and seasonality. Residuals may reflect random fluctuation, one-off events or a pattern the model has missed.
A decomposition is only as useful as its assumptions. If your data has a rising trend, a seasonal pattern may grow with it; a multiplicative model can represent that better than an additive one. An additive model suits patterns whose seasonal changes stay roughly similar in size over time.

Choose the right interval and inspect the data
Start with the decision you need to make. Daily data may help you manage campaign spend, but it can be noisy for a monthly revenue plan. Weekly or monthly aggregation can make the direction clearer, while too much aggregation can hide short-lived changes that matter.
Keep the interval consistent where possible. Check whether timestamps use the same time zone, whether daylight saving changes affect the clock, and whether a reporting period means a calendar month or a rolling interval. When observations arrive irregularly, do not treat the gaps as if they were equal time steps. You may need to aggregate to a regular interval, retain elapsed time explicitly, or use a method built for irregular observations.
Plot the raw series before choosing a model. Add labels for campaign launches, price changes, holidays, tracking updates and other known events. A chart can show a sudden level shift or a recurring weekly pattern that a summary table conceals.
Also check for missing observations and outliers. A missing day may mean zero activity, a tracking failure or a delayed data feed, and those explanations call for different treatment. Investigate unusual values against source records and business context before removing or replacing them.
Moving averages and year-over-year comparisons
A moving average smooths short-term variation by averaging observations across a rolling window. It can make a trend easier to see in daily web traffic or weekly leads, but it also softens sharp changes and may lag behind a genuine turning point.
Choose a window that matches the pattern you want to examine. A seven-day moving average can reduce weekday and weekend swings in daily traffic. A longer window smooths more variation, but it can also hide a recent change that your team needs to act on.
For strongly seasonal metrics, compare like with like. Year-over-year comparison puts a month, quarter or week beside the corresponding period in the previous year, helping to control for recurring calendar effects. Pair that comparison with a trend view: one year-on-year increase can still be a temporary rebound rather than a lasting shift.
Seasonal adjustment removes an estimated recurring seasonal effect so you can inspect the underlying movement. It can help compare consecutive periods, but keep the unadjusted figures too: they show the actual demand your teams need to serve.
Autocorrelation, stationarity and model choice
Time-ordered observations are often dependent. Autocorrelation measures how a series relates to its own past values at different lags. If this week’s leads tend to resemble last week’s, lagged values contain information that a model can use.
A stationary series has statistical properties, such as its mean and variability, that remain broadly stable over time. Many traditional methods work best when a series is stationary. A visible trend or changing variance suggests non-stationarity; plots, rolling summaries and formal tests such as the augmented Dickey-Fuller test can help assess it.
Model choice follows the pattern and the purpose:
- Exponential smoothing gives more weight to recent observations. Variants can model a level, a trend and seasonality, making them practical for many operational forecasts.
- ARIMA combines autoregressive terms, differencing and moving-average terms to model dependence over time. Seasonal ARIMA adds terms for repeating seasonal intervals.
- Frequency-domain methods examine how variation is distributed across different frequencies. They can help identify recurring periodic patterns, especially when the cycle is not easy to see in a time plot.
- Machine-learning methods can combine lagged metrics with other variables, such as campaign spend or price. They need careful validation and enough relevant data to avoid learning noise.
A univariate time series uses one measured variable, such as monthly revenue. A multivariate time series models multiple variables together, such as traffic, leads, spend and sales. Series may also be discrete, like daily order counts, or continuous, like a sensor reading recorded through time.
Time series analysis differs from ordinary regression because observations are not usually independent. Regression can still be part of the analysis, particularly when you include time effects or external variables, but you must account for temporal dependence rather than assume the order is irrelevant.

Build and validate a simple forecast
Forecasting is most useful when it supports a specific decision. Define the metric, forecast horizon, interval and intended use first. Predicting next month’s lead volume calls for a different horizon and level of detail from planning annual revenue.
- Prepare the series. Check definitions, timestamps, gaps, outliers and changes in tracking or reporting.
- Explore its shape. Plot the data, look for trend and seasonality, and inspect autocorrelation and residual patterns.
- Set a baseline. Compare a model with a simple forecast, such as carrying the latest value forward or repeating the matching seasonal period.
- Fit a suitable method. Try a method that reflects the pattern, then keep the model only if it improves on the baseline in a meaningful way.
- Test forward in time. Train on earlier observations and evaluate on later ones. Rolling-origin evaluation repeats this process at successive cut-off points.
- Communicate uncertainty. Present a forecast range or prediction interval alongside the central estimate, so decision-makers can see that future outcomes are not certain.
A random train-test split can leak future information into model training and make performance look better than it is. Time-ordered splits preserve the sequence and provide a more realistic test of how the model will work in practice.
Transformations need equal care. Differencing can remove a trend and help a model meet stationarity assumptions, but it changes the scale of interpretation. When you forecast, reconstruct the results on the original scale before presenting them to stakeholders.
Separate prediction from explanation
A model can use advertising spend to predict leads without proving that the spend caused the leads. Both may have changed because of a seasonal campaign, a new offer or another factor. Predictive association is useful, but causal conclusions need a design that can isolate the effect of an intervention.
External variables can improve forecasts when they are available at the time the forecast is made. Include their future values only when you can reasonably know or plan them; otherwise, the model may rely on information that will not exist in a real forecasting situation.
Watch for structural breaks: sudden changes in the level, trend or relationship between metrics. A tracking migration, pricing change, new market or shift in customer behaviour can make older observations less representative. Mark known events, inspect residuals for persistent patterns, and test whether recent data supports a different model.

Make the analysis useful to marketing and sales
For web traffic, time series analysis can distinguish a steady rise in visits from a repeatable weekday pattern or a brief campaign spike. For leads, it can show whether a change in volume persists after adjusting for seasonality. For revenue, it can help teams plan around recurring peaks while monitoring departures from the usual pattern.
Strong analysis also depends on strong measurement. Our Digital Web Analytics service supports GA4 and Google Tag Manager setup, tracking plans and reporting, helping teams build a consistent foundation for web metrics.
When you need to clean, examine and interpret sequential data, our Data Analysis service works with time-series data as well as other data types, using Python, R and SQL. We start with the question you need answered, then shape the analysis around that decision.
For teams that need to monitor patterns regularly, Custom Power BI dashboards can organise business data into views built around specific decisions. The point is not to add more charts. It is to make the signal easier to understand and act on.
Frequently Asked Questions
How much historical data do I need before forecasting?
It depends on the forecast horizon, data frequency and pattern you need to model. A seasonal forecast needs enough history to observe repeated seasonal behaviour, while a simple near-term baseline may be useful with less data.
Can I forecast several seasonal patterns at once?
Yes, some methods can model multiple seasonal periods, such as weekly and annual effects in daily data. Confirm that each pattern is supported by enough observations and compare the result with a simpler forecast.
What if my marketing calendar changes every year?
Calendar effects that move, such as a campaign tied to a changing event date, may not behave like fixed seasonality. Record the event dates as explanatory variables and assess whether the information will be available for future forecasts.
Can I use a log transformation when revenue includes zeros?
A standard logarithm is undefined at zero, so it cannot be applied directly to a series containing zero values. Choose a transformation that fits the values and the business meaning, then reverse it carefully when communicating forecasts.
How far ahead should a business forecast?
Set the horizon to the decision the forecast must support, such as campaign allocation or inventory planning. Forecast accuracy usually becomes less certain further into the future, so validate performance at the horizons your team will actually use.
Should I update a forecast when historical data is revised?
Yes, if the revision changes the underlying series or corrects a material measurement issue. Keep track of the data version and forecast date so teams can distinguish a genuine performance change from a later correction to past records.
Conclusion
Time series analysis helps you separate a lasting trend from seasonal noise by examining time order, recurring patterns, dependencies and changes in the data. Start with a clear business question, inspect the series, compare with a simple baseline and validate every forecast using data from the past to predict the future.
With a consistent measurement foundation and a clear analytical plan, your team can make better decisions about traffic, leads and revenue.

Founder of MarTech Stack. SEO, analytics and marketing automation.
LinkedIn