

Business analytics turns relevant data into evidence for a commercial decision. For European B2B marketing and commercial leaders, the work starts with a clear question, tests whether the data can answer it, then connects the findings to action.
Key Takeaways
- Begin with a decision. Name who will act, what they could do and how success will be measured.
- Choose the right level of analysis. Descriptive, diagnostic, predictive and prescriptive analytics answer different questions.
- Check the inputs. Incomplete, inconsistent or unrepresentative data can make a confident-looking result misleading.
- Match the method to the task. SQL, spreadsheets, Python, R, experiments and dashboards each serve different purposes.
- Interpret results in context. A pattern is not automatically a cause, and a forecast is an estimate, not a promise.
- Assign the next step. Give someone responsibility for acting on the finding and reviewing what changed.
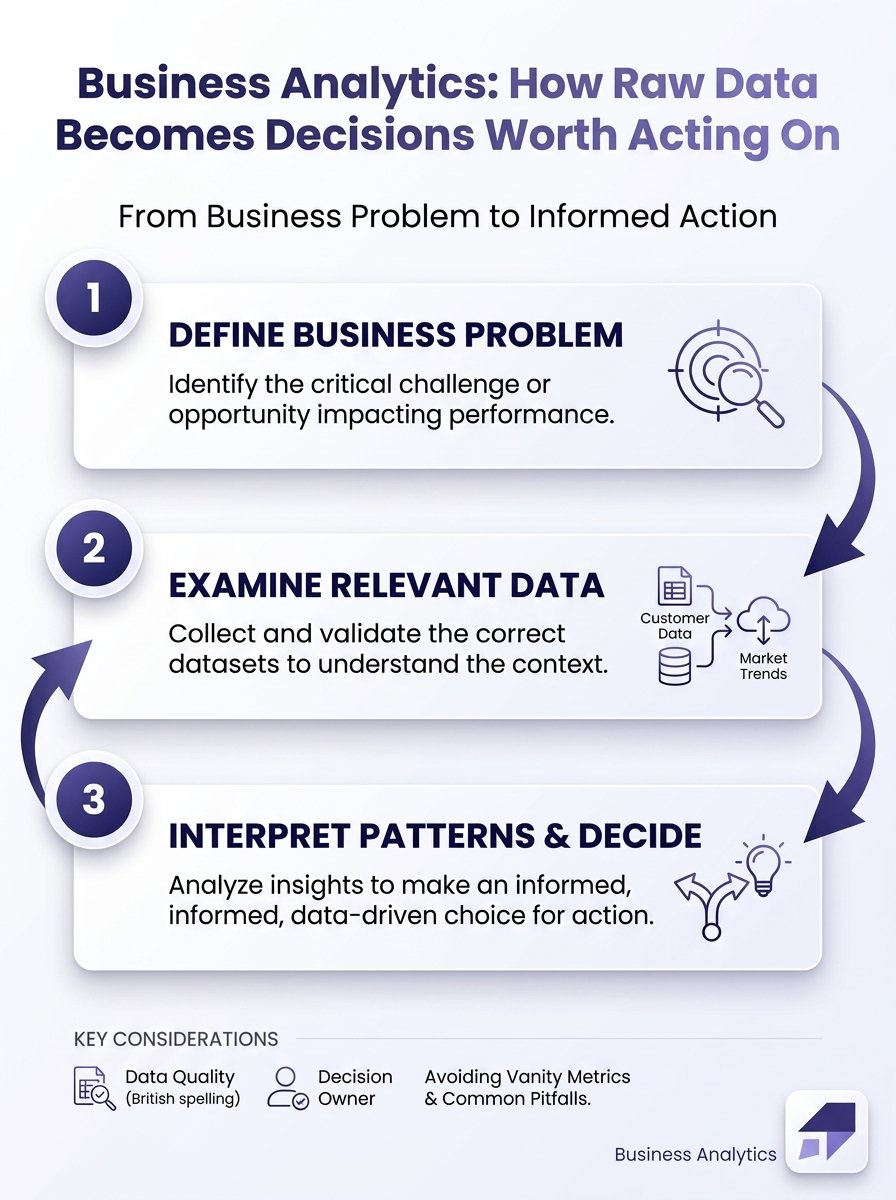
This infographic illustrates how business analytics turns a business problem into informed action.
What business analytics does and its four types
Business analytics uses data and analytical methods to improve business decisions. It begins with a question and turns relevant records into evidence, recommendations or estimates, rather than stopping at stored data or a chart.
A useful starting framework is to ask what happened, why it may have happened, what may happen next and which action could improve the outcome. These questions correspond to four types of analytics:
| Type | Question it answers | Example in a B2B business |
|---|---|---|
| Descriptive analytics | What happened? | How many opportunities reached a defined sales stage last quarter? |
| Diagnostic analytics | Why may it have happened? | Which sources, segments or stages are associated with the change? |
| Predictive analytics | What may happen? | What range of pipeline could progress under current conditions? |
| Prescriptive analytics | Which action may produce a better outcome? | Which change should the team test or prioritise? |
The four types can form a sequence, but a team does not need to use all of them for every decision. A clear descriptive comparison may be enough to guide a small operational change; predictive modelling adds value when a decision depends on what could happen next.
Business analytics is a discipline; a business analyst is a job title. A business analyst may work on requirements, processes and stakeholder coordination, as well as data, while analytics work can sit with commercial, marketing, revenue operations or data teams. For related examples of practical data questions, see the Data & Attribution articles.
Start with the decision, not the dashboard
Before choosing a metric or opening a dashboard, name the decision owner and the action they could take. Without a person who can act, and a realistic choice to make, analysis can become an interesting report with no effect on the business.
Turn a broad concern into a question that points towards a decision. For example, instead of asking why pipeline is weak, ask which lead sources produce opportunities that progress to a defined sales stage, and whether the team should change how it invests in those sources.
Set the success measure and baseline before examining the results. Qualified meetings can act as a leading indicator of sales activity, while revenue is a lagging outcome that shows what has already converted.
Define the scope and time horizon, too. Specify the customer groups, channels, sales stages and period that matter, so the analysis stays focused on the decision rather than drifting towards metrics that are easy to find but irrelevant.

Check whether the data can support the answer
Business analytics depends on usable inputs. Check completeness, consistency, duplicates, timestamps and tracking definitions before interpreting a result; inconsistent campaign names or CRM stages can make comparisons between periods or teams misleading.
Then check whether the records cover the customers, channels and time period relevant to the question. If one customer segment is missing, or the observation window is too short to capture a typical buying cycle, the apparent pattern may not represent the wider business.
For marketing teams, reliable measurement starts with clear event and consent practices. Digital Web Analytics covers GA4 and Google Tag Manager setup, with work that can include tracking audits, consent checks, tag inventories, data quality baselines, KPI mapping and GA4 property reviews. That makes it relevant when a team needs to establish whether its measurement foundation can support the question.
Privacy and access controls belong in the analysis design, not as an afterthought. Use only the information needed to answer the question, restrict access to sensitive records and account for applicable European data-protection obligations.
Finally, look for bias in how records were collected or excluded. Document limitations such as missing segments, changes in tracking or differences in sales processes, so a result is not presented as representative beyond what the data can support.
Choose a method and tool that fit the question
Choose tools according to the data, the decision and the team’s capability. SQL retrieves and combines structured records; a spreadsheet can support a small, transparent check; Python or R can make repeated cleaning, statistical analysis and modelling easier to reproduce.
Choose the analytical method just as deliberately. Segmentation compares customer groups, cohort analysis follows groups over time, and forecasting helps when planning depends on a range of plausible future outcomes.
Data Analysis uses Python, R and SQL to clean, examine and interpret data, and can provide statistics, forecasts and findings explained in plain language. It suits work where the team needs to move from business data analysis to an interpretation that decision-makers can use.
Where feasible, use an experiment to test whether a change caused an outcome. When you cannot run a suitable experiment, treat an observed relationship as evidence of association, not proof of causation.
Visualisation and dashboards help people monitor decisions, but they do not replace analysis. Choose a view that makes the relevant measure easy to understand, and set its level of detail for the people who will use it.

Interpret patterns in their business context
Compare results across dimensions that matter to the decision, such as customer segment, acquisition channel, sales stage and time period. Check that each group contains enough comparable observations before treating differences as meaningful.
In B2B marketing and commercial work, analytics can show which segments progress through the funnel, where opportunities stall, or how demand and conversion vary across channels. The same approach can support finance teams examining cash-flow patterns, operations teams investigating delays and HR teams reviewing recruitment or retention processes.
Predictive outputs are estimates, not promised outcomes. When a forecast informs planning, explain its assumptions and show a plausible range so leaders can understand how much the result may change under different conditions.
Business analytics and business intelligence work together, but they are not identical. Business intelligence commonly organises and presents data through reports and dashboards; analytics investigates a question and supports a choice. A dashboard may show where conversion changed, while analysis examines what could explain the change and what to do next.
Data science overlaps with business analytics, especially when work uses statistical methods or predictive modelling. The distinction is one of emphasis: business analytics centres on decisions and business outcomes, while data science can cover a broader range of technical questions and data products.
Turn findings into action and check what changed
A finding becomes useful when it leads to a specific recommendation. State the rationale, the expected outcome and the main uncertainty, and avoid describing a correlation as a causal effect unless the evidence supports that claim.
Custom Power BI builds clean database views and tables, then designs dashboards around the decisions a client makes. It fits the action stage when a team needs a clear way to monitor defined measures after turning an analysis into a decision.
Give the recommendation an owner, a decision date and a measure for reviewing the result. Those details make it clear who is responsible for the next step and when the team will judge whether the action helped.
Where possible, compare the result with a baseline or a suitable control. Account for seasonality and other changes in the business that could explain an apparent improvement or decline.
Keep monitoring after implementation, then revise the action or the analysis if outcomes differ from expectations. A forecast or recommendation is a working basis for a decision, not a final verdict that should be left untouched.
Build the skills and habits that make analysis useful
Useful business analytics skills combine data literacy and analytical reasoning with practical technical ability. Teams benefit from people who can query data with SQL, make transparent checks in spreadsheets and present a result clearly; Python or R becomes valuable when work needs repeatable cleaning or more advanced analysis.
Technical skill alone is not enough. Analysts need business understanding to recognise which measures matter, and communication skills to explain assumptions, limitations and implications in plain language.
Make responsibilities explicit. Data owners maintain definitions and quality checks, analysts select and explain methods, and decision-makers interpret the findings in context and take responsibility for action.
Watch for vanity metrics such as traffic or impressions viewed in isolation. They can describe activity, but they do not show whether a commercial objective is being met unless the team connects them to a stated decision or outcome.
Work in this field can sit in roles such as marketing analyst, commercial analyst, revenue operations analyst, data analyst or business intelligence analyst. The job title varies; the useful capability is turning evidence into a decision the organisation can own.

Frequently Asked Questions
Can a small B2B team benefit from business analytics without a dedicated data scientist?
Yes. A small team can build useful analytical practice by assigning a clear role to someone who understands the business context and can protect time for follow-through. Specialist support can be brought in for work that requires deeper statistical or engineering capability.
Does business analytics require artificial intelligence or machine learning?
No. Many valuable analyses use comparisons, segmentation, trend review or experiments without machine learning. Use AI or machine learning only when the task genuinely needs a prediction or classification and the team can evaluate its output.
Can business analytics use qualitative information such as customer interviews?
Yes. Interview notes, sales-call themes and customer feedback can help explain a numerical pattern or reveal a factor that is absent from structured records. Apply a consistent coding approach to themes so different reviewers can compare how they interpreted the material.
What should a team do when an analytical result conflicts with managers’ experience?
First, identify the specific cases or assumptions behind the disagreement rather than dismissing either account. Managers may know about a process change or customer segment that the analysis does not capture, and that detail can point to a useful follow-up test.
How often should a B2B team revisit an analysis?
Set the review rhythm according to how quickly the decision and its underlying data can change. A live pipeline decision may need closer attention than a longer-term assessment of acquisition mix, while a stable measure may not benefit from frequent re-analysis.
Conclusion
Business analytics is most useful when it connects a specific business question to trustworthy data, a careful interpretation and an action with a named owner. Start with the decision, choose the level of analysis it needs, then measure what changed and learn from the result.
That is how raw data becomes a decision worth acting on: clear evidence, grounded in business context, with responsibility for what happens next.

Founder of MarTech Stack. SEO, analytics and marketing automation.
LinkedIn