
Business forecasting estimates what may happen next, so your marketing, finance and operations teams can make better-informed decisions. The key is knowing what the forecast can support, how uncertain it is, and when a trend is strong enough to act on.
Key takeaways
- What is business forecasting? It is an estimate of a future business measure, based on data, business drivers, judgement or a combination of these.
- Which forecasting method should you use? Match the method to the decision, the data available and how far ahead you need to look.
- How do you check forecast accuracy? Backtest against periods the model did not use, then compare it with a simple baseline.
- What does a prediction interval show? It gives a plausible range of outcomes around a central forecast, making uncertainty visible.
- When is a trend actionable? When it persists, has a credible explanation and is large enough to change a decision despite normal forecast error.
- How does forecasting support planning? It informs choices about staffing, stock, campaigns and cash, while remaining distinct from budgets and targets.
What a business forecast can and cannot tell you
A business forecast is an estimate of a future measure based on historical data, current drivers, expert judgement or a combination of them. It helps you choose what to do; it does not promise that a particular outcome will happen.
Forecasts can answer different questions. Sales forecasting estimates future sales or revenue to support commercial planning, while demand forecasting helps teams plan stock, service capacity and staffing.
Financial forecasting can look at expected income and costs, while cash flow forecasting focuses on when money may enter or leave the business. Capital forecasts help leaders consider investment needs and the timing of major commitments.
These estimates turn plausible future demand or revenue into practical choices. A marketing team might use them to plan campaign activity; operations might use them to prepare capacity; finance might use them to assess cash requirements.
Keep a forecast separate from a budget, target and plan. A forecast estimates what may happen, a target sets an intended outcome, a budget defines financial limits or allocations, and a plan describes the actions people will take.
Match forecasting methods to the question and evidence
Qualitative forecasting uses structured judgement, while quantitative forecasting uses numerical data and statistical methods. Many useful business forecasts combine the two: a model provides a consistent starting point, and people with relevant knowledge assess whether its assumptions still fit.
There is no single best model for sales forecasting. Choose a method by considering what drives the measure, how stable the business conditions are, how much usable history you have and how far ahead the decision needs to look.
| Method | Best suited to | What to watch |
|---|---|---|
| Qualitative judgement | New products, sparse history or changed conditions | Make assumptions explicit and gather views in a structured way. |
| Moving average | Relatively stable data with short-term noise | A longer averaging window smooths more noise but responds more slowly to a shift. |
| Exponential smoothing | Series where recent observations should count more | Choose a form suited to the pattern, rather than adding complexity without a reason. |
| Regression-based forecasting | Outcomes linked to measurable drivers | Check whether the relationship is credible and likely to persist. |
| Time-series models | Series with useful information in their own history | Test whether past structure remains relevant to the horizon ahead. |
When each approach fits
Use qualitative judgement when there is little relevant history or the business has changed. Ask sales, operations and subject experts to estimate independently against shared assumptions; a Delphi-style process can help reduce the influence of the loudest voice in a group.
Use a moving average to smooth short-term fluctuations in reasonably stable data. A longer window dampens volatility, but it lags when the underlying level changes, so it can be a poor fit when the business is moving quickly.
Use exponential smoothing when recent observations should carry more weight than older ones. Simple smoothing suits a stable level, while trend-adjusted and seasonal forms can account for other recurring patterns without demanding a complex model for every series.
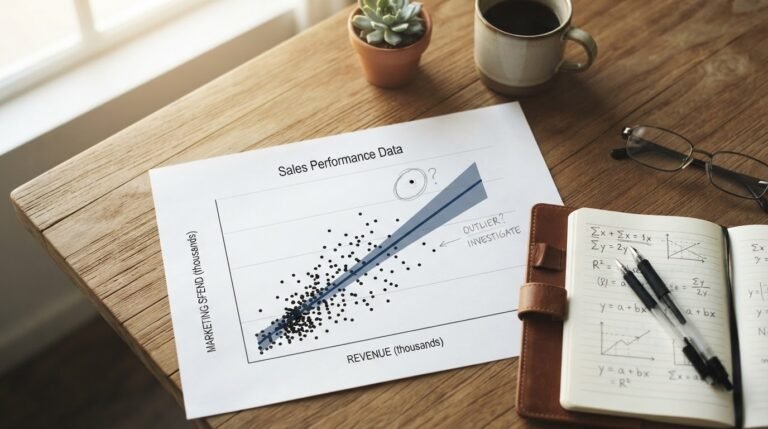
Use regression analysis when a measurable driver, such as price, leads or marketing activity, helps explain the outcome. The model can show how an outcome has moved alongside a driver, but that relationship needs to make business sense and remain plausible over the forecast horizon.
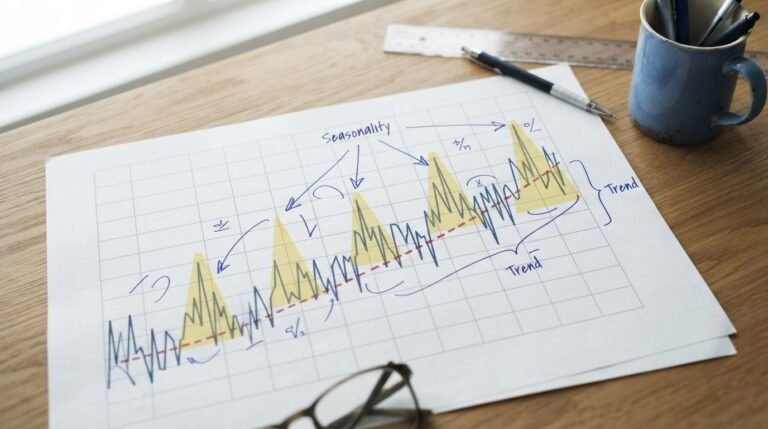
Use time-series models when the series’ own level, trend and recurring structure carry useful signal. Seasonal decomposition is a related analysis step that can help identify recurring patterns; it is not itself a forecasting method. Combine statistical output with informed judgement when events or plans are not captured by the series.
Whichever approach you choose, start with the decision rather than the model. A short-term staffing decision may need a responsive estimate, while a longer investment decision calls for careful scrutiny of assumptions and alternative outcomes.
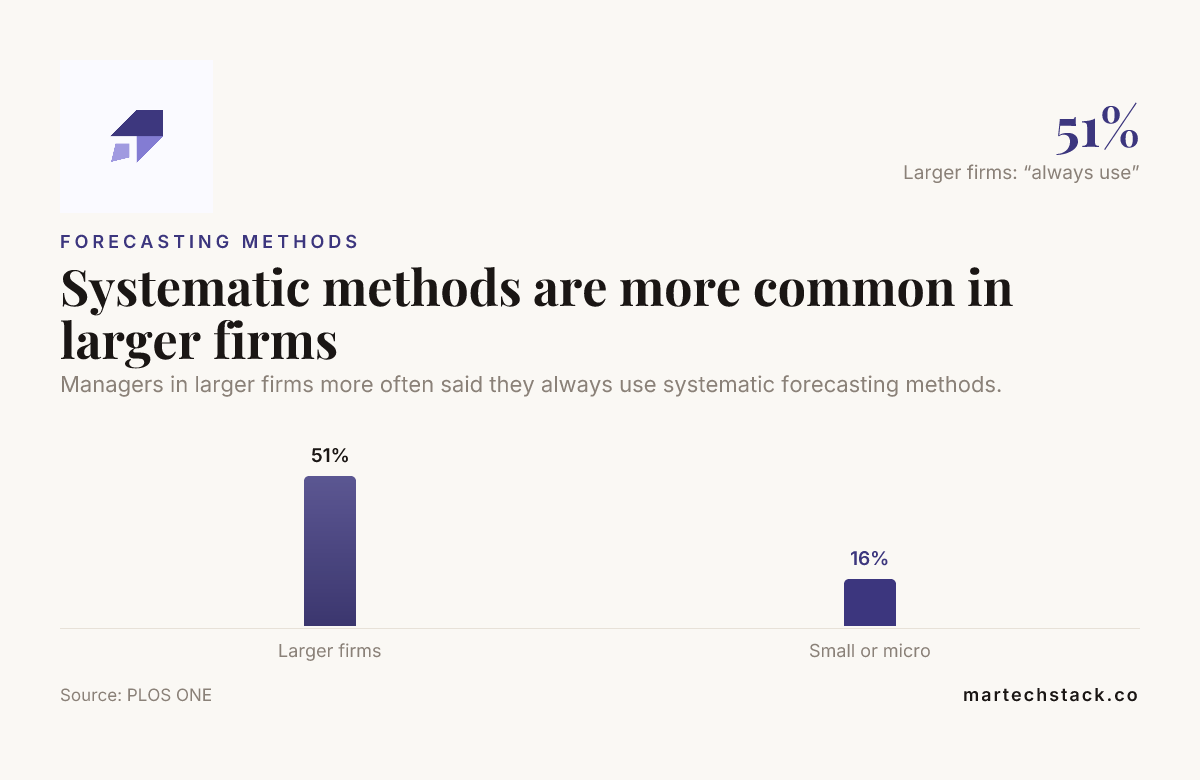
Managers in larger firms more often said they always use systematic forecasting methods.
Source: PLOS ONE
The PLOS ONE paper reports managers’ stated forecasting practices. This is context about reported use, not evidence that firm size causes systematic forecasting or that it improves forecast accuracy; it is not a rule for choosing a method.

Prepare the data and make assumptions visible
Start by defining the measure, unit, time interval and forecast horizon. Align dates and definitions across CRM, finance and operations records before modelling so that the series means the same thing throughout.
Check for missing periods, duplicate records, late entries and changes in reporting definitions. Reconcile totals to a trusted source, and document corrections rather than silently filling gaps or changing past values.
Write down the drivers and assumptions behind the estimate. Planned price changes, campaigns, staffing levels and capacity limits can all change the outlook, so decision-makers need to see what the forecast assumes will happen.
Separate one-off events from repeatable patterns. A major contract, supply interruption or exceptional promotion may alter a result for a particular period; treating it as a regular pattern can distort the baseline and the forecast that follows.
When your team needs help cleaning records, applying statistical methods or producing forecasts, Data Analysis uses Python, R and SQL, with findings explained in plain language. That makes it relevant when you need to turn inconsistent inputs into a usable, clearly communicated forecast.
Test forecasts against history before relying on them
Backtesting shows how a forecasting method would have performed using only the information available at the time. Fit the method on earlier data, compare its forecast with a later period held back from fitting, then repeat from several forecast origins.
Repeated tests help reveal whether a model works consistently or got one result right by chance. Compare it with a simple baseline, such as carrying forward the latest value or using a recent average; a more complex model needs to improve useful forecasts consistently to earn its place.
Choose error measures that suit the decision. Mean absolute error (MAE) describes the typical size of the error in the measure’s own units, while root mean squared error (RMSE) gives larger misses more weight.
Under-forecasting and over-forecasting can have different operational costs. Review them separately when, for example, a low demand estimate could leave a team short of capacity while a high estimate could tie up resources unnecessarily.
Check forecast errors across the horizon that matters to the decision and across important segments, such as product lines or regions. If errors repeatedly cluster in a particular segment or direction, look for a missed driver or a change in the business environment.

Read uncertainty as a range, not a single promise
Present a central forecast alongside a prediction interval. The central value gives a useful summary, while the interval shows a range of outcomes consistent with the model’s uncertainty and assumptions.
Intervals tend to widen further into the future because more can change between now and then. They can also understate uncertainty when market conditions or the business process shift, so a narrow range based on past behaviour may not reflect a new situation.
Use scenarios when important drivers could follow different plausible paths. State what each scenario assumes about factors such as price, campaign response or capacity, and do not present a best-case or worst-case outcome as equally likely by default.
Keep uncertainty visible in dashboards and decision papers. A point estimate on its own can look like a commitment, even when it is only the central value in a wider range of possible outcomes.
Use a decision rule to decide when a trend is actionable
A trend is stronger evidence for action when it persists across successive observations, has a plausible business driver or independent supporting evidence, and remains meaningful against normal forecast error. One new data point is a signal to inspect, not enough on its own to establish a lasting direction.
Set the action threshold before the next result arrives. Act when the estimated effect is large enough to change the decision and the likely cost of waiting outweighs the cost and reversibility of acting.
Scale the response to the strength of the evidence. When a trend is suggestive but uncertain, try a small, reversible adjustment; reserve major commitments for signals that hold up under backtesting, scenario review and scrutiny of the assumptions.
For example, if leads rise but the increase is within the usual forecast error, keep monitoring the signal. If the rise persists and is supported by a credible change in campaign activity, a limited adjustment to staffing or campaign allocation can test the implication without committing to a large change too early.
Reassess when actual results fall outside the prediction interval or a key driver changes. Update the estimate and explain whether the shift reflects new evidence, a revised assumption or a method that no longer describes the business well.
Keep forecasts connected to planning and operations
Give each forecast an owner who is accountable for its inputs, assumptions and update schedule. Set the review cadence to suit the decision, and revisit the estimate sooner when actual results or business conditions change materially.
Use forecasts to inform budgets and operating plans, but keep the likely outcome separate from the target and the resources management chooses to commit. This distinction lets teams update their view of what may happen without quietly rewriting their intended outcome.
Share the forecast horizon, assumptions, uncertainty and decision implications with marketing, finance and operations. Teams can then plan from a common view instead of acting on conflicting versions of expected demand, revenue or cash.
Review forecast errors alongside the decisions made. A miss may reflect noisy data, a changed driver, an unsuitable method or an action that altered the outcome, so revise the part of the process that actually needs attention.

Frequently asked questions
Can a language model do business forecasting?
A language model can help organise forecasting assumptions, draft analysis code or explain a forecast workflow; use a reproducible calculation or model for the numbers, then check its inputs and outputs before making a business decision. For more on applying AI in business, see AI for business.
How much historical data is enough to make a forecast?
There is no universal minimum: the useful amount depends on the measure, how often it is recorded and the patterns the forecast needs to capture. If your decision depends on recurring annual behaviour, include enough history to assess that behaviour rather than relying on a short run of recent observations.
What should a team do when actual results fall outside the prediction interval?
First check that the reported actual is complete and uses the same definition as the forecast. Then identify whether a one-off event, a changed driver or a forecasting weakness best explains the miss, and record the finding for the next review.
How should a business forecast a new product with no sales history?
Build an initial estimate from relevant analogues, planned pricing, distribution and commercial assumptions, and label those inputs clearly. As early evidence arrives, compare it with the assumptions and replace estimates with observed product-specific behaviour.
Is MAPE a suitable accuracy measure when demand is intermittent or sometimes zero?
MAPE can mislead when actual demand is zero because the percentage error is undefined, and very small actuals can make it disproportionately large. For intermittent demand, consider an error measure that stays interpretable for zero values, alongside an assessment of whether errors cause stock or capacity issues.
Conclusion
Business forecasting is most useful when the method fits the decision, the data is prepared carefully and uncertainty stays visible. Test forecasts against history, make assumptions explicit and act when a persistent, credible trend is large enough to change the decision.
When evidence is uncertain, take a proportionate step and keep learning from actual results. That turns forecasting into a working part of planning, rather than a single number mistaken for a promise.

Founder of MarTech Stack. SEO, analytics and marketing automation.
LinkedIn